Blood Donation Tracking
Published Oct 2, 2025
🩸
Over two years ago I signed up to donate my blood, I’m not a fan of needles or looking at my own blood being extracted from my arm but I go anyway. I hope the blood I’ve donated over the years has contributed to advance science and even save a few lives.
I wanted to visualise the donations I’ve made against the milestones the NHS show on your account. Unfortunately there’s no API or a method for me to extract the data out so for now I’m updating this manually but that’s fine as I can only donate once every few months.
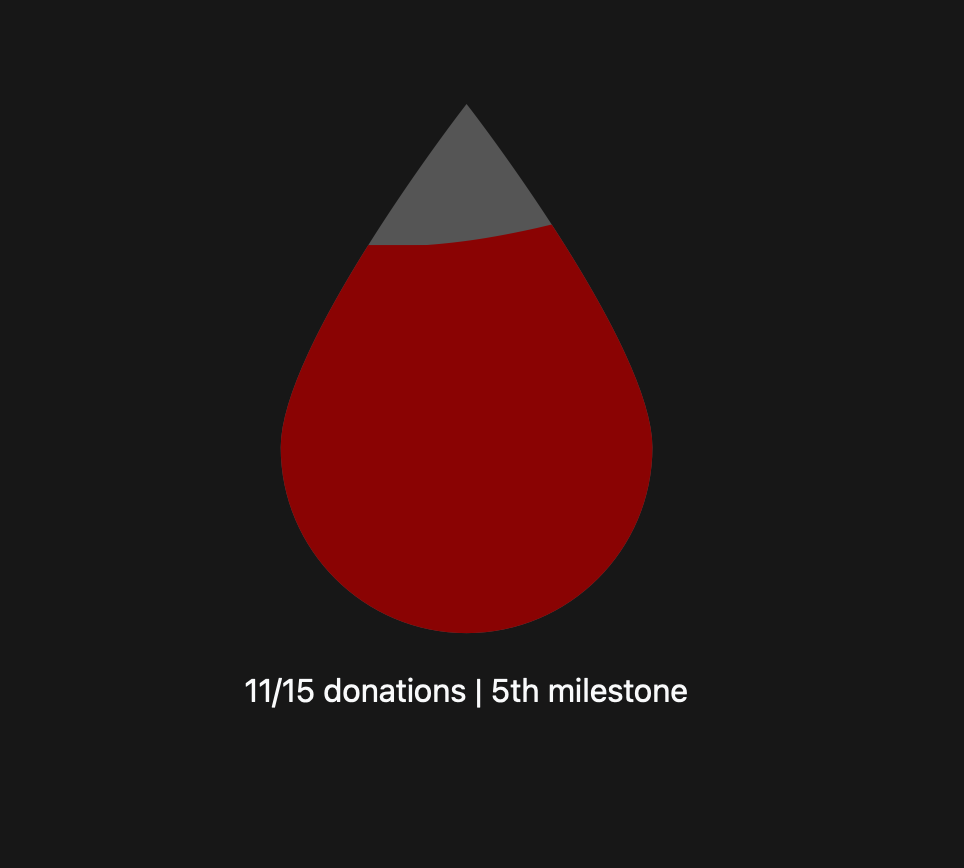
I found online an SVG pictorial fraction animation which I thought was perfect for this little project. I set that up as a component in a SvelteKit project and found the HEX code for the colour of blood (it’s #8a0303).
The site started off with just the one droplet showing the current donations to milestone.
I wanted to take this further though, I wanted to show all the milestones from the blood.co.uk website so I copied the component five more times and applies some props so I can set a level against each one.
To get the fill level I simply divide the number of donations against the milestone to give my a percentage of how full the component should be.
I made the page into a grid of three columns and two rows and it’ll shuffle down to one column when resized for mobile displays.
Finally I wanted to have a go at self-hosting this so I’ve got the app deployed on a Docker container on my RPi. I use a small .sh script that pulls the main branch from GitHub and rebuilds the app. I’m next going to take a look at automating deployment when changes to main are committed
Go and check it out! blood.imjr.me